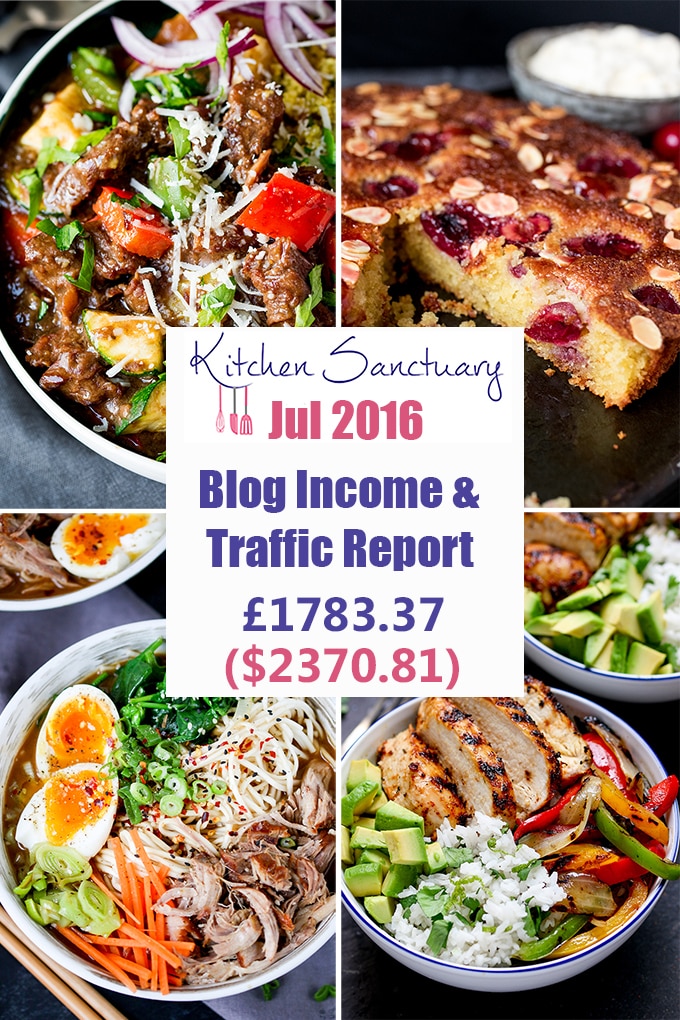
Interested in knowing some of the behind the scenes stuff for Kitchen Sanctuary? Here’s the latest in my blog income and traffic report July 2016. Check out my previous reports here.
I hope the info in this post gives you some insight and ideas if you’re new to blogging and monetization. Also check out my How to Start a Food Blog post if you are thinking about giving this blogging thing a go too!
Income Breakdown
Note – there are some links in this post that are affiliate links – which means that if you click on them and then sign up to the service/product I’ll get a small commission (at no extra cost to you of course). If you do click through then thanks!
Income (fyi – this info is based on earning reports and invoices for work done in the month of July, it’s not based on money that has actually come in yet, so there may be some variations based on things like paypal fees or exchange rate fluctuations):
- Freelance writing: £1156.91 ($1537.99)
- MediaVine: £557.79 ($741.53)
- Photo Licensing £178.70 ($237.56)
- Amazon Affiliate sales £19.52 ($25.95)
- FoodBloggerPro affiliate sales £8.73 ($11.60)
- StudioPress Genesis Theme affiliate sales £0 ($0)
- How I earned $40k in my first year of blogging affiliate sales £15.01 ($19.96)
- Tasty Food Photography £0 ($0)
- The Food Photography book affiliate sales £0 ($0)
Total = £1936.66 ($2574.59)
Expenses (currently this includes regular payments for tools, membership fees and advertising but not inconsistent things like courses, trips and props):
-
- FoodBloggerPro: £15.67 ($20.83)
- Hosting and backups: £11.70 ($15.55)
- Tailwind: £6.02 ($8.00)
- MailChimp £22.57 ($30)
- Adobe creative cloud £45.73 ($60.79)
- Facebook Ads £26.12 ($34.73)
- Twitter Ads £14.00 ($18.61)
- OptinMonster£11.49 ($15.27)
Total = £153.29 ($203.78)
Net Profit = £1783.37 ($2370.81)
Traffic
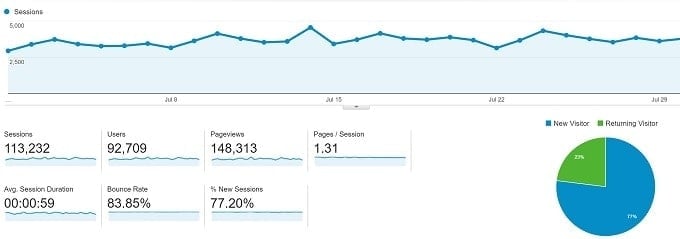
My traffic has been up and down over the past few months, and I was expecting it to continue that way for July, however it jumped up by fair bit (approx 25k more pageviews than in June) Here’s a screenshot from Google Analytics for July:
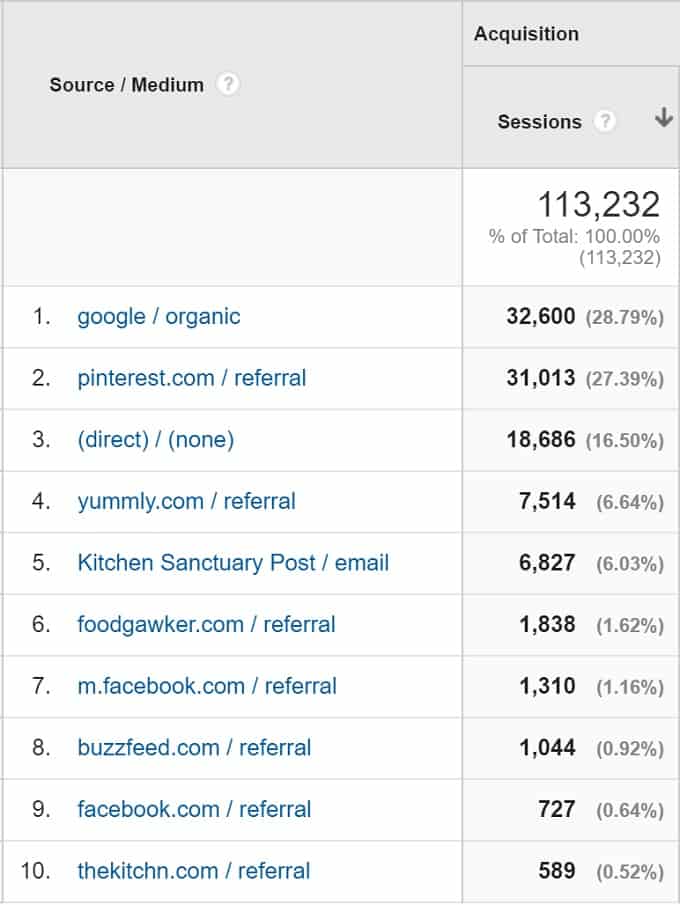
Here’s a breakdown of my traffic sources based on the number of sessions:
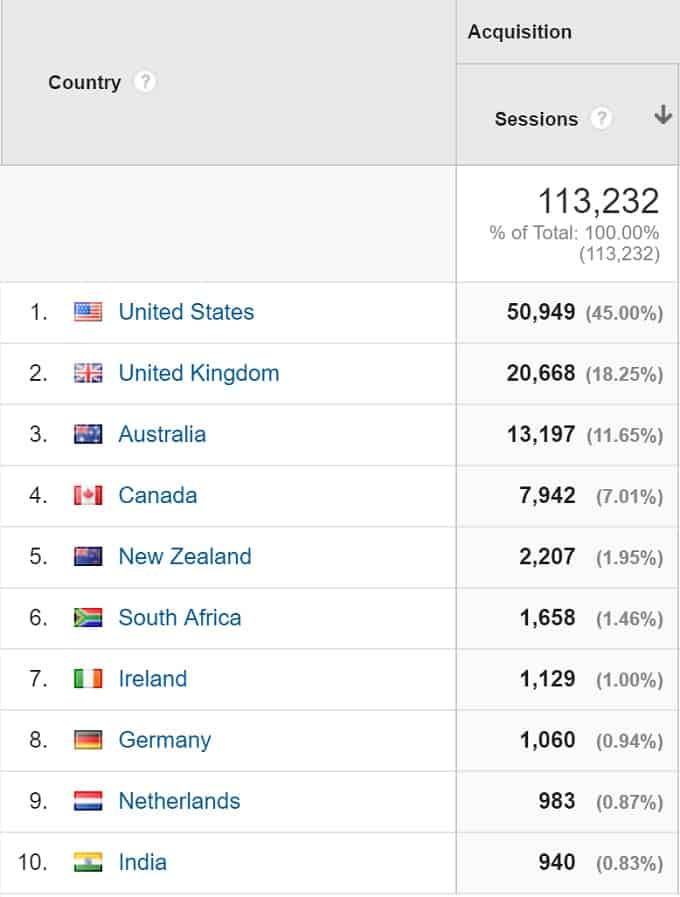
Here’s the info on the location of my readers:
As we were on holiday for a third of July, I spent the other two-thirds working like a maniac – trying to get all my freelance work completed and trying to schedule posts for Kitchen Sanctuary.
I was a bit frazzled by the time holiday came around, so it was wonderful to have a well earned rest!
The only other thing of note for July was that I experimented with a bit of Facebook advertising. I occasionally spend £5 to promote an individual post, but this time I spent £30 on a month long campaign to try to get my Facebook page in front of people who currently aren’t aware of KS. The campaign got amazing results (more than 1500 likes), and I then tried to do the same thing in August. Unfortunately, despite using the same criteria, my next campaign totally tanked – with less than 200 likes. I plan to do some Facebook training in September (when the kids are back at school and I can hear myself think!), so I’ll share any learnings with you in the coming months.
That’s all for the July report. I hope you’ve found this info helpful. Please let me know if there’s anything you want me to talk about in a future report. Just drop me a note in the comments 🙂